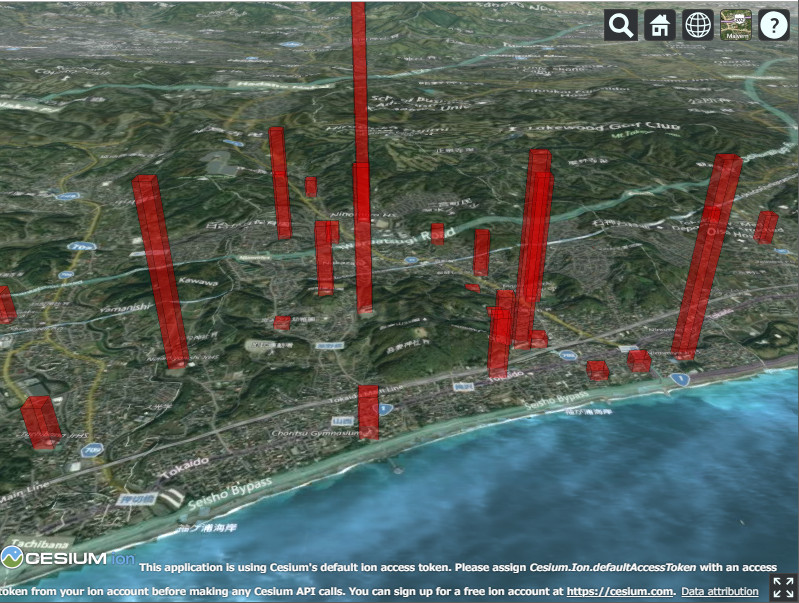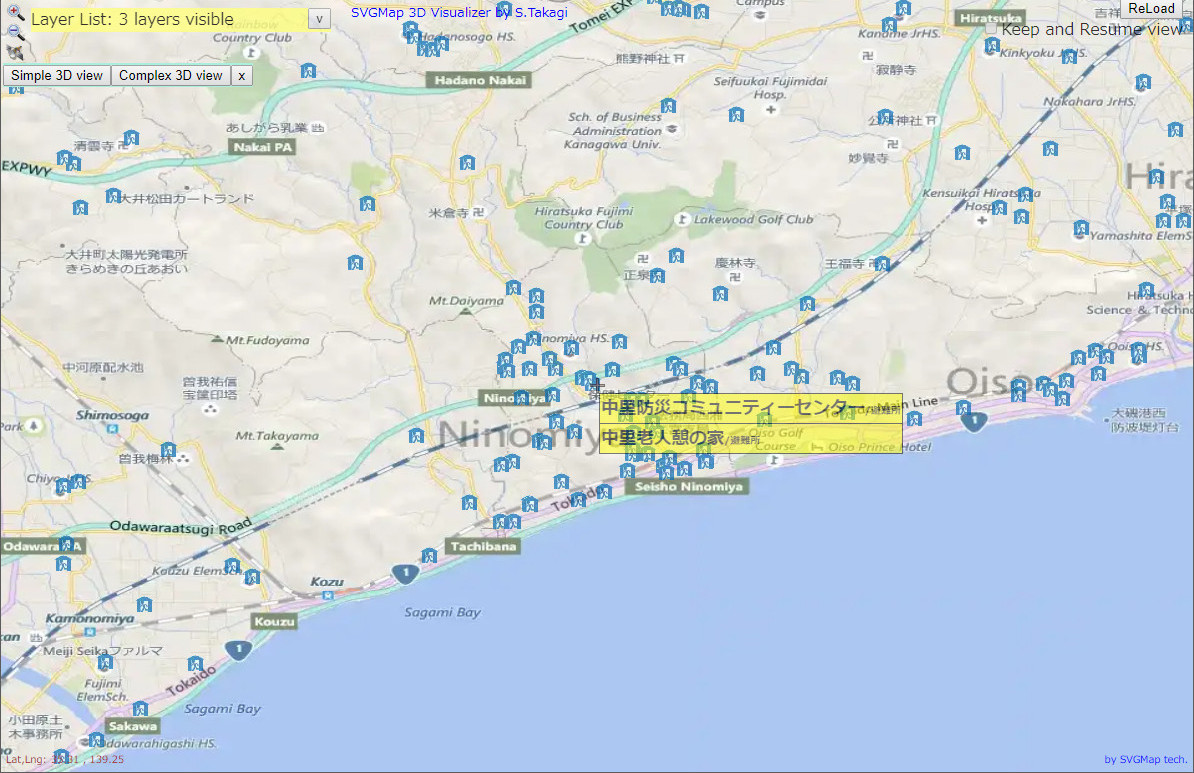

This is a system that visualizes SVGMap contents with CESIUM. It can bring the potential of SVGMap such as mashup of various web contents and visualization of big data by Quad Tree Composite Tiling to 3D visualization function.
First, select the area and layers you want to visualize on the basic 2D viewer of SVGMap, then press the 3D button and select simple or complex to open the 3D Map Window with CESIUM. You can press that button as many times as you like.
 | ⇐ |  |